Tesla went from 2,650 deliveries in 2012 to over 1.8 million in 2023 — a growth curve that made the entire auto industry nervous. Then came the dip nobody saw coming. Was it a stumble, a reset, or something far more telling about where electric vehicles are actually headed? The answer challenges everything analysts thought they knew about Tesla’s dominance.
Tesla Yearly Delivery Totals: The Complete Breakdown
Tesla’s yearly delivery numbers tell a story that’s hard to argue with: from zero vehicles shipped in 2011 to over 1.8 million in 2023, the company built one of the fastest production ramp-ups in automotive history. You’re looking at a timeline where 2,650 deliveries in 2012 grew into 245,240 by 2018, then exploded past 936,000 in 2021.
That course reflects serious gains in production efficiency, particularly through Gigafactory expansions that compressed manufacturing timelines markedly. Expanding charging infrastructure also played a role, making Tesla ownership practical enough to drive demand at scale. The Supercharger V4 network has been expanding globally, improving speeds and compatibility to further reduce range anxiety for prospective buyers.
But the story isn’t purely upward. After peaking at 1,808,581 deliveries in 2023, totals dipped to roughly 1.789 million in 2024, then dropped further to 1,636,129 in 2025 (an 8.6% decline year-over-year).
That’s the first sustained retreat Tesla has faced. The numbers are still massive, but the streak is clearly over. Much of the earlier surge in demand was fueled by the Model 3, which successfully targeted the mainstream segment and consistently ranked among the world’s best-selling all-electric vehicles by 2024.
How Tesla Deliveries Grew From 2013 to 2017
Between 2013 and 2017, Tesla’s annual deliveries climbed from 22,477 to 103,097 vehicles — a 4.5x increase driven almost entirely by a single model before the Model 3 era even started.
That’s an extraordinary run, especially when you consider that wider battery adoption was still finding its footing across the broader automotive industry.
You’re looking at a company that went from 2,650 deliveries in 2012 to crossing the 100,000 milestone in 2017.
The Model S carried most of that weight early on, with the Model X joining in 2015 to add a second delivery source.
Year-over-year growth peaked at roughly 60% in 2015 — a direct signal that manufacturing scale was expanding faster than most analysts expected.
Each year built on the last, compounding volume without a sprawling model lineup.
That’s discipline. Or stubbornness. Possibly both.
During this same period, Tesla was also laying the groundwork for its proprietary Supercharger network, which addressed range anxiety and made long-distance electric travel practical for growing numbers of buyers.
As Tesla delivery numbers continue to climb year after year, more owners are depending on Sentry Mode and dashcam recordings to capture what happens around their vehicle—but the standard storage setup can quickly become a bottleneck when important clips get overwritten. That’s why many drivers upgrade to dedicated high-capacity recording storage built specifically for Tesla’s constant monitoring system, such as this dash cam and Sentry Mode storage solution ensuring key moments aren’t lost just because space ran out at the wrong time.
How Tesla Tripled Deliveries Between 2018 and 2020
From 2018 to 2020, Tesla roughly doubled its annual delivery volume — growing from 245,240 vehicles to 499,550, a 103.7% increase over just two years. That’s impressive, though worth clarifying: “tripled” oversells it. You’d need roughly 735,720 deliveries for a true triple.
The real story is production scaling. Tesla’s manufacturing engine shifted dramatically when Model 3 and Model Y became the dominant output drivers, with Model 3/Y production alone reaching 454,932 units in 2020. Shanghai’s Gigafactory added momentum late that year, expanding Tesla’s global footprint beyond California.
Pricing strategy also played a role. Tesla positioned the Model 3 as an accessible entry point (relative to earlier models), pulling in buyers who previously couldn’t justify the cost. Q4 2020 alone delivered 180,570 vehicles — nearly matching Tesla’s entire 2017 output. Whatever you call the growth rate, the course was undeniably sharp. The Model Y, which would go on to become the world’s best-selling car in 2023 with over 1.2 million Tesla units delivered that year, was just beginning to establish itself as the company’s mainstream anchor during this period.
Tesla Nearly Doubled Annual Deliveries in 2021: Here’s the Data
In 2021, Tesla delivered 936,172 vehicles globally — an 87% jump over 2020’s 509,737 — coming close enough to a true doubling that the distinction barely matters. Model 3 and Model Y did the heavy lifting, accounting for 911,208 of those deliveries (roughly 97.3%). Tesla also demonstrated real price elasticity with both models, adjusting prices multiple times throughout the year to keep demand healthy despite tightening margins.
Production bottlenecks — the kind that plagued every automaker in 2021 — didn’t stop Tesla from beating Wall Street’s consensus estimate of 897,000 units by nearly 39,000 vehicles. Shanghai and Fremont both ran hard. Q4 alone delivered 308,600 vehicles, a 71% year-over-year increase that crushed analyst expectations of around 267,000. Model S and Model X contributed a modest 24,964 units (2.6%), maintaining brand prestige without carrying volume weight. The numbers tell a straightforward story: Tesla was scaling fast. Buyers drawn in by those 2021 deliveries were also entering an ownership experience with notably lower running costs, as Tesla’s annual maintenance expenses typically run 50%–70% less than comparable gasoline vehicles.
Did Tesla Deliveries Peak in 2023?
2023 marked Tesla’s all-time delivery peak, with the company pushing out 1,808,581 vehicles globally—a 38% year-over-year jump that also set a new quarterly record in Q4 (484,507 deliveries) and finally cleared the 1.8 million threshold Tesla had originally targeted.
The Model 3/Y pairing carried the overwhelming weight of that figure, accounting for 1,739,707 of those deliveries and confirming that Tesla’s volume strategy still runs almost entirely through its mid-range lineup.
What followed that record year, however, was a measurable pullback in delivery growth—driven by a combination of factors including aggressive price cuts eating into demand signaling, increased global EV competition, and production capacity beginning to outpace real-world buyer appetite. Supporting that growing buyer base, Tesla’s Supercharger network scale had already crossed 40,000 stalls by 2022 and continued expanding to meet the charging demands of its largest-ever fleet.
2023 Record Delivery Numbers
Q4 2023 closed the year with a record 484,507 vehicles delivered in a single quarter, surpassing the prior Q2 record by roughly 18,000 units. Momentum, clearly, was still building. For buyers taking delivery that year, home charging costs typically ran between $11 and $23 per full charge depending on the model and local utility rates.
Post-Peak Decline Begins
After setting that 1,808,581-delivery record in 2023, the obvious question became whether Tesla had just crested its growth curve or was simply pausing before another leg up. The data leans toward the former. Q4 2024 deliveries landed around 495,600 units — a brand record, technically — but that figure sat roughly 7.1% below Q3 2024, signaling softer momentum rather than renewed acceleration.
Tesla leaned on post-peak strategies like pricing adjustments to sustain demand, yet the broader trajectory looked more like stabilization than a fresh breakout. You’re essentially watching a hyper-growth company shift into a mature delivery pattern. The steep climb from 367,500 units in 2019 to 1.8 million in 2023 was extraordinary; expecting that same velocity to continue indefinitely was always optimistic. Meanwhile, on the technology side, Tesla’s driver-assistance suite continues to expand through tiers like Basic Autopilot, Enhanced Autopilot, and FSD Supervised, though all remain classified as SAE Level 2 systems requiring continuous driver oversight.
Contributing Factors Explained
Whether 2023 marked Tesla’s true delivery ceiling is the question worth unpacking, because the numbers since then have consistently pointed in one direction. Deliveries slipped 1.1% in 2024, then dropped a sharper 8.6% in 2025, landing at 1,636,129 units. That’s not noise — that’s a trend.
Several forces converged. Supply constraints eased post-pandemic, which actually helped 2023 hit its record 1,808,581 units. But afterward, intensifying competition from BYD, Hyundai, and Kia absorbed market share Tesla once owned largely by default. Regulatory shifts compounded the pressure — the $7,500 U.S. federal EV incentive expired September 30, 2025, removing a meaningful purchase trigger. You’re fundamentally watching Tesla steer a maturing market where early-adopter tailwinds no longer mask the harder work of sustaining volume. Tesla’s global manufacturing footprint spans 4 active facilities across the United States, Europe, and Asia, yet even that production capacity hasn’t been enough to reverse the declining delivery trend. Within that lineup, flagship models like the Model X carry starting prices around $84,990 and compete in a premium segment where buyers increasingly weigh luxury EV alternatives from established automakers alongside Tesla’s offerings.
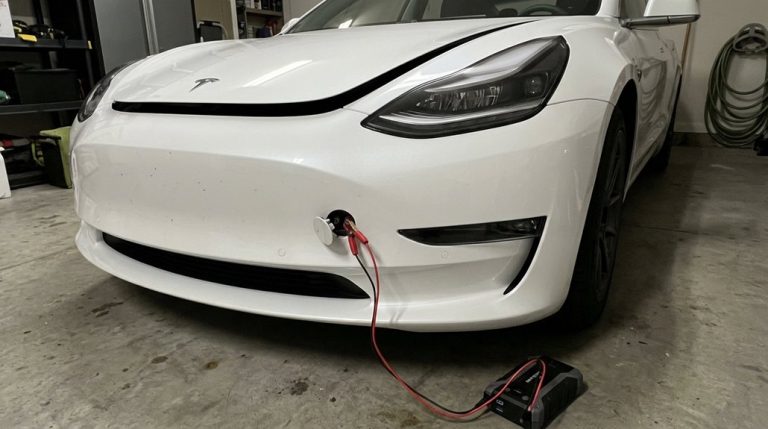
As Tesla delivery numbers continue rising year after year, more vehicles on the road also means more everyday situations where small issues can quickly become inconvenient—like a flat tire, a dead 12V battery warning, or being stuck roadside without basic tools within reach. That’s why many owners keep a compact safety kit in the trunk for unexpected moments, such as this Tesla emergency roadside safety kit so minor disruptions don’t turn into long delays waiting for assistance in situations that could have been handled immediately.
Why Tesla Deliveries Fell in 2024 and 2025
Tesla’s first annual delivery decline in over a decade didn’t happen in a vacuum — it happened because market saturation, intensified global competition (particularly from BYD challenging Tesla’s battery-electric vehicle dominance), and genuine demand softness all converged on the same year at once.
You’re looking at a full-year 2024 total of 1,789,226 vehicles, a -1.07% drop from 2023’s 1,808,581, where early production interruptions from the Model 3 refresh ramp compounded an already fragile demand environment.
The 2025 outlook didn’t offer much relief either, as price cuts continued pressuring margins while newer model mix shifts and rising EV competition kept delivery growth firmly in question. Buyers navigating this period of rapid model-year changes should note that redesigns like the Model 3 Highland broke compatibility for roughly 80% of existing interior accessories, underscoring how quickly Tesla’s product cadence can disrupt the broader ownership ecosystem.
Market Saturation Pressure
When a company sells nearly 1.8 million vehicles in a single year and still gets called underperforming, you know the market has fundamentally shifted. That’s exactly where Tesla landed in 2024.
The saturation indicators were hard to ignore: Model 3 and Model Y combined for 1,704,093 deliveries, representing the overwhelming bulk of Tesla’s volume. When two models carry that much weight, you’re no longer chasing fresh buyers — you’re waiting on replacement cycles.
Demographic shifts compound this reality. Early adopters already own Teslas. Mainstream buyers are slower to convert, more price-sensitive, and increasingly eyeing competitors like the Chevy Equinox EV, which offers a total cost of ownership advantage that makes the switch from gas vehicles genuinely compelling for budget-conscious families.
Tesla’s first annual delivery decline in over a decade wasn’t a stumble — it was the market quietly announcing it had grown up.
Rising Competition Impact
Losing ground to BYD by just 24,234 vehicles over a full calendar year isn’t a rounding error — it’s a warning shot. Price competition intensified throughout 2024, and market fragmentation made it harder for Tesla’s narrow model lineup to absorb the pressure.
Here’s what the competitive terrain actually looked like:
- BYD sold 595,413 passenger BEVs in Q4 2024 alone, overtaking Tesla for the second time
- Chinese manufacturers competed aggressively on price, features, and regional availability
- Tesla’s Model 3/Y dependency left it exposed when rivals targeted those exact segments
- Overall EV adoption grew, meaning Tesla lost share not just volume
When the category expands but your slice shrinks, that’s the market telling you something worth hearing.
Demand Slowdown Factors
Competition from BYD explains part of the 2024 story, but it doesn’t explain all of it. Tesla’s own pricing strategy created real friction. Repeated discounts trained buyers to wait for better deals, producing classic incentive fatigue across the market. You can only cut prices so many times before price elasticity works against you — demand doesn’t expand indefinitely just because the sticker drops.
Factory disruptions during the updated Model 3 ramp-up crushed Q1 2024, providing roughly 386,810 vehicles (well below the pace needed for annual growth).
Full-year deliveries landed at 1,789,226 — a 1.07% decline year over year, Tesla’s first annual drop in over a decade.
Q4 recovered to 495,570, but missed analyst expectations of roughly 504,770, confirming demand remained softer than models predicted.
Tesla’s Quarterly Delivery Breakdown by Year
Breaking Tesla’s annual delivery numbers into quarterly chunks reveals where the company actually builds momentum—and where it stumbles.
Breaking Tesla’s delivery data into quarterly chunks reveals exactly where momentum builds—and where it quietly falls apart.
Seasonality trends show Tesla consistently front-loads production but back-loads deliveries, meaning Q4 typically dominates the quarterly mix each year.
Here’s what the 2025 breakdown actually looked like:
- Q1 2025: 336,681 deliveries — the weakest quarter, down 13% year over year
- Q2 2025: 384,122 deliveries — Model 3/Y carried 373,728 of those units alone
- Q4 2025: 418,227 deliveries — the strongest quarter, with Model 3/Y commanding 97% of volume
- Other Models (Q4 2025): just 11,642 units, confirming the Cybertruck and premium lineup remain niche contributors
You’re seeing a familiar pattern here.
Tesla builds through the year, then pushes hard at year-end.
That Q4 surge isn’t accidental — it’s structural, baked into how Tesla manages production cycles and delivery logistics.
Frequently Asked Questions
How Does Tesla Count a Delivery Versus a Production Unit?
Tesla’s delivery definition means they’ve handed the car to you. Production counting tracks when they’ve built it at the factory. A unit can be built but not yet delivered, sitting in inventory or transit.
Which Tesla Models Contributed Most to Record-Breaking Annual Delivery Numbers?
Model 3 and Model Y dominated Tesla’s model mix, driving 97% of Q4 2025 deliveries. You’ll find regional demand consistently favored these two high-volume platforms across every record-breaking annual delivery period.
How Do Tesla’s Delivery Totals Compare to Other Major EV Manufacturers Globally?
Tesla’s still a top BEV seller globally, but you’re watching market share tighten fast. BYD dominates total EV volume through PHEVs, and intensifying price competition from Hyundai, Kia, and Volkswagen keeps squeezing Tesla’s lead.
Does Tesla Report Delivery Numbers Differently Across Various International Markets?
Wondering about regional reporting? Tesla doesn’t adjust for currency adjustments or local formats—you’ll find they report one global delivery total, while regional breakdowns come from third-party registration trackers, not Tesla directly.
What Percentage of Tesla Deliveries Historically Came From North American Customers?
Tesla doesn’t publicly disclose the North American Regional Share of its deliveries. You won’t find an official historical percentage because Tesla’s delivery reports break out figures by model line, not customer geography.