Most Tesla owners assume the Supercharger slowdown is a flaw. It isn’t — it’s a calculated electrochemical negotiation happening in real time between the cabinet’s DC output and your battery management system. Understanding exactly why your kilowatts taper, and precisely when that taper works *for* you rather than against you, changes how you’ll charge forever. This guide breaks down the science, strategy, and battery tech behind Tesla’s charging curve so you can stop losing time at every stop.
What Is a Tesla Supercharger and How Does It Work?
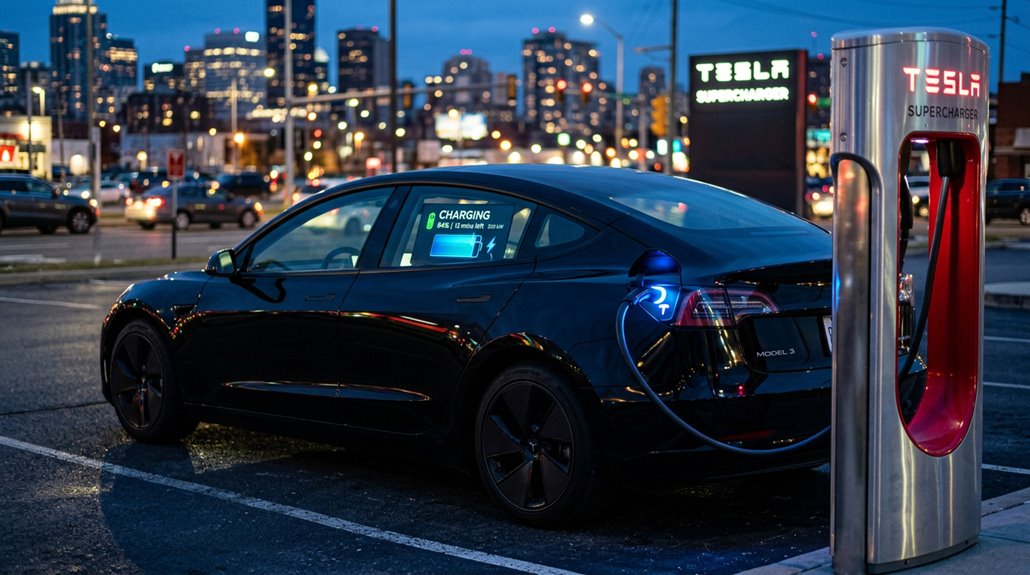
Charge speed peaks when the battery is low and tapers progressively as it fills, a deliberate electrochemical safeguard rather than a design flaw.
Charging slows as your battery fills — not a flaw, but electrochemistry protecting the pack from the inside out.
A Tesla Supercharger is a dedicated DC fast charger that bypasses your vehicle’s onboard AC charger entirely, delivering current straight to the battery pack. Station equipment converts grid AC to DC before it ever reaches your car. Once you plug in, the stall and your battery management system negotiate power limits in real time.
Cold batteries charge slower (chemistry moves sluggishly at low temperatures), which is why battery preconditioning matters — Tesla’s route guidance automatically warms the pack before arrival. The Equinox EV vs Ioniq 5 charging speed comparison highlights how vehicles without active preconditioning lose meaningful time at fast chargers due to cold battery penalties.
Connector ergonomics keep the process straightforward: plug in, walk away. Power sharing between stalls means your rate can fluctuate when neighbors join the circuit. The charging system is fully weatherproofed for use in rain, wind, and snow.
The History of Tesla’s Supercharger Network, 2012 to Now
Tesla launched its Supercharger network on September 24, 2012, alongside Model S production, rolling out six stations across California to tackle range anxiety on routes like San Francisco to Los Angeles.
From that modest debut, the network scaled aggressively through corridor-first expansion — hitting 380 stations by 2014 and reaching roughly 7,900 stations with 75,000-plus connectors worldwide by late 2025.
The hardware kept pace with that growth, climbing from 90 kW early units to 120 kW upgrades in 2013, V2 at 145 kW in 2016, and current V4 installations pushing up to 500 kW at select sites. The V4 Supercharger cabinet, announced on November 14, 2024, takes this further by supporting up to 1.2 MW of charging capacity.
Network Launch Origins
When Tesla launched its Supercharger network on September 24, 2012, nobody was calling it a revolution—just six stations scattered across California, rated at roughly 90 kW each, positioned along corridors where Model S owners actually needed them.
That corridor placement wasn’t accidental. Tesla’s early strategy prioritized intercity routes where range anxiety hit hardest, connecting cities rather than dotting suburban parking lots. Each station could add approximately 150 miles of range in around 30 minutes—a dramatic contrast to Level 2 AC charging, which routinely demanded several hours.
The network was proprietary from day one, meaning only Tesla vehicles could access it. That exclusivity felt limiting then, but it gave Tesla complete control over reliability, speed, and the overall ownership experience drivers were paying premium prices to enjoy. The decision to build a private, proprietary network required massive capital investment to bypass the sparse and unreliable public charging infrastructure that existed at the time.
Expansion Across Continents
What started as six stations hugging California’s busiest corridors in 2012 scaled into something genuinely difficult to ignore—roughly 7,900 Supercharger stations and more than 75,000 connectors spread across three major global regions by November 2025.
Europe came online in 2013 with 14 stations (modest by any standard), prioritizing cross border corridors that linked cities across national borders.
Asia Pacific eventually matched North America’s roughly 3,000-station footprint, reflecting aggressive regional partnerships with local market stakeholders across China, Japan, South Korea, and Australia.
Europe currently holds approximately 1,500 stations.
Tesla’s expansion logic stayed consistent throughout: connect high-traffic travel routes first, urban density second.
That corridor-first strategy reduced range anxiety systematically rather than accidentally, turning a California experiment into the world’s largest fast-charging infrastructure platform. The network launched on September 24, 2012, with just five stations concentrated along California’s busiest travel corridors before expanding outward across the continent.
Hardware Evolution Milestones
That global footprint didn’t materialize overnight—it was built on a decade of incremental hardware decisions, each generation pushing power delivery closer to what drivers actually needed on real roads.
- 2012: 90 kW stations launched alongside Model S production
- 2013: Upgraded to 120 kW, tightening legacy protocols from earlier hardware baselines
- 2016: V2 arrived at 145 kW, improving trip viability considerably
- V3 era: Peak power and thermal consistency became priorities
- Current: 500 kW deployments, with materials sourcing influencing cell and cabinet design
Each jump wasn’t arbitrary—it reflected real engineering constraints, grid infrastructure limits, and battery chemistry tolerances.
The network now spans over 20,000 stations globally, a scale that makes long-distance travel a practical reality rather than a calculated risk.
You’re basically watching Tesla roll out decades of charging infrastructure development into roughly twelve years, one kilowatt increment at a time.
V2, V3, and V4 Superchargers: What Actually Changed
Each Supercharger generation represents a meaningful leap, not just a spec-sheet refresh.
V2 units delivered 120–150 kW but shared power between paired stalls, meaning your neighbor’s session directly throttled yours.
V3 fixed that in 2019, pushing peak output to 250 kW with independent stall delivery and liquid-cooled cables (a genuine cable ergonomics upgrade that made connectors noticeably lighter and easier to handle).
V4 maintains similar 250 kW consumer limits today but is built around future proofing capacity for higher thresholds down the road. Practically, V4’s longer cables reach awkward port locations that V3 couldn’t. Some V4 stalls also include card readers, which is quietly useful. Hardware on V4 units is designed to support up to 500 kW as infrastructure and vehicles catch up.
Think of each generation as solving the previous one’s most annoying limitation.
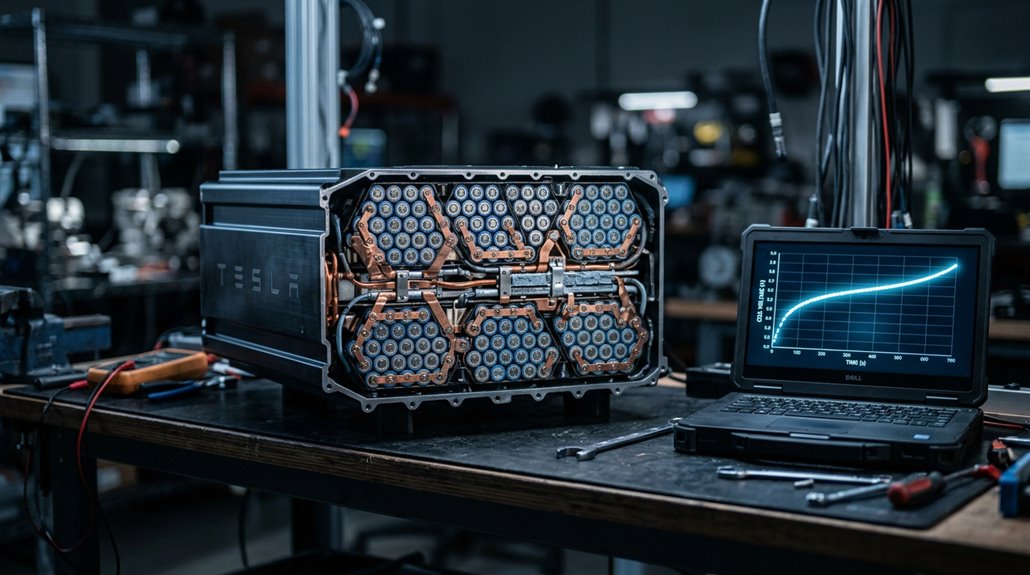
Inside a V4 Supercharger Cabinet: Hardware, Rails, and Power Architecture
When you crack open a V4 Supercharger cabinet (figuratively — Tesla’s not handing out tours), you’re looking at a tray-based modular design housing roughly 16 internal power conversion modules that collectively handle AC-to-DC rectification at grid scale.
Each tray contributes to a shared power rail capable of pushing up to 1,200 kW in Semi-oriented deployments or up to 500 kW for passenger vehicles, with voltage support spanning approximately 400 V through 1,000 V and current output reaching around 615 A at peak demand.
That single cabinet can distribute regulated high-voltage DC across up to eight dispensers simultaneously, shifting available capacity responsively between stalls based on real-time vehicle acceptance — meaning the cabinet’s doing the heavy thinking while your car’s battery management system decides how much it’ll actually take. Many sites are also being paired with Megapack energy storage or solar installations to reduce grid strain and manage peak loads at these high-power cabinets.
V4 Cabinet Core Components
Crack open a V4 Supercharger cabinet and you’re looking at a purpose-built AC-to-DC conversion system engineered around one core objective: pushing as much power as possible into a vehicle as fast as the chemistry allows.
The hardware inside reflects serious engineering discipline across material selection, thermal control, and serviceability practices.
- Approximately 16 internal power trays stack inside a single 1,000V-class enclosure
- Each tray functions as a modular conversion stage, not one monolithic block
- Liquid cooling runs cabinet-wide, handling sustained high-current output
- Internal fans assist airflow, keeping component temperatures manageable
- Aluminum components reduce overall weight without compromising structural integrity
That modular tray design isn’t accidental.
It means technicians can swap individual stages during maintenance rather than pulling the entire cabinet — a deliberate serviceability win baked into the original design.
The entire system operates at an efficiency rating above 96%, ensuring that minimal energy is lost during the AC-to-DC conversion process.
Power Rail Architecture
The power-rail backbone running through a V4 Supercharger cabinet is where the real engineering story starts — not at the dispenser you plug into, but at the high-voltage conversion layer feeding it. Grid AC enters, gets converted to regulated DC, then distributes across up to eight stalls through shared power rails supporting 400V to 1,000V designs. That modular integration allows one cabinet (rated up to 1.2 MW) to replace what previously required multiple V3 units.
| Rail Parameter | V3 Cabinet | V4 Cabinet |
|---|---|---|
| Max Output Capacity | ~250 kW | 1.2 MW |
| Stalls Served Per Cabinet | 2 | Up to 8 |
| Voltage Architecture Support | 400V | 400V–1,000V |
| Power Density Improvement | Baseline | ~3x higher |
| Thermal Management Approach | Passive/liquid | Active tuned |
Cable optimization and thermal management work together here — thicker busbars handle higher current loads while active cooling prevents derating under sustained megawatt-class demand. The cabinet is also engineered to pair directly with Megapack battery systems on-site, enabling energy storage integration that buffers peak demand and reduces grid strain at high-utilization stations.
High-Voltage Output Design
What sits behind that sleek V4 pedestal matters far more than the cable you plug in — and that’s where the cabinet’s high-voltage output design earns its reputation. Tesla engineered this system to handle up to 1000V across roughly 615 amps, demanding serious high voltage safety protocols throughout.
Here’s what makes it work:
- Insulation materials rated for sustained high-voltage exposure prevent arcing between internal rails
- Cable cooling keeps conductors thermally stable at peak 500 kW output
- Connector standards support both legacy 400V vehicles and next-generation 1000V platforms
- Dynamic load balancing distributes power intelligently across up to 8 stalls
- Silicon carbide electronics convert AC grid power with minimal thermal waste
That combination isn’t accidental — it’s deliberate future-proofing. The V4 cabinet carries 1 MW of power, meaning existing V3 infrastructure can support V4 pedestals during retrofits without requiring full grid upgrades at every location.
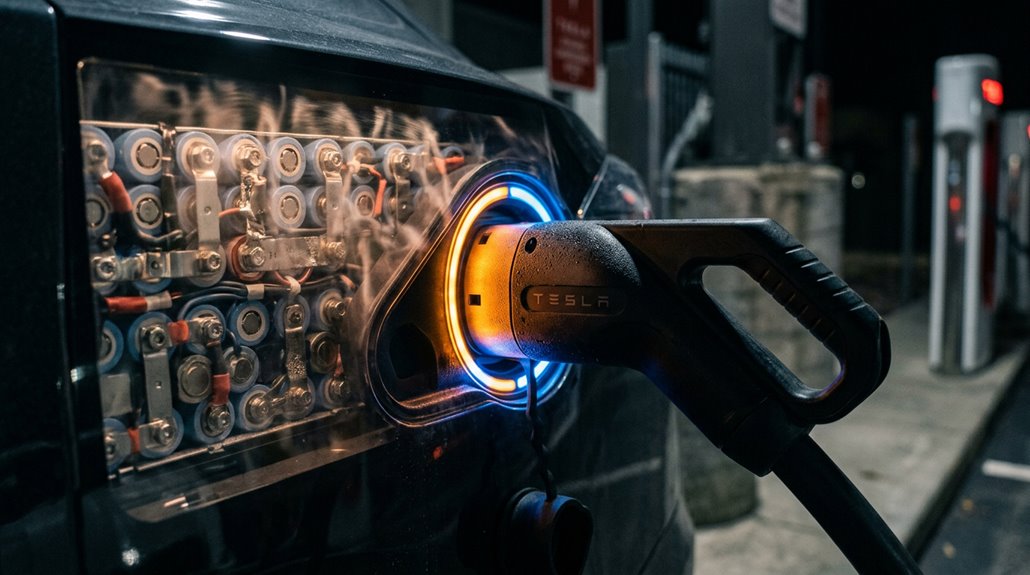
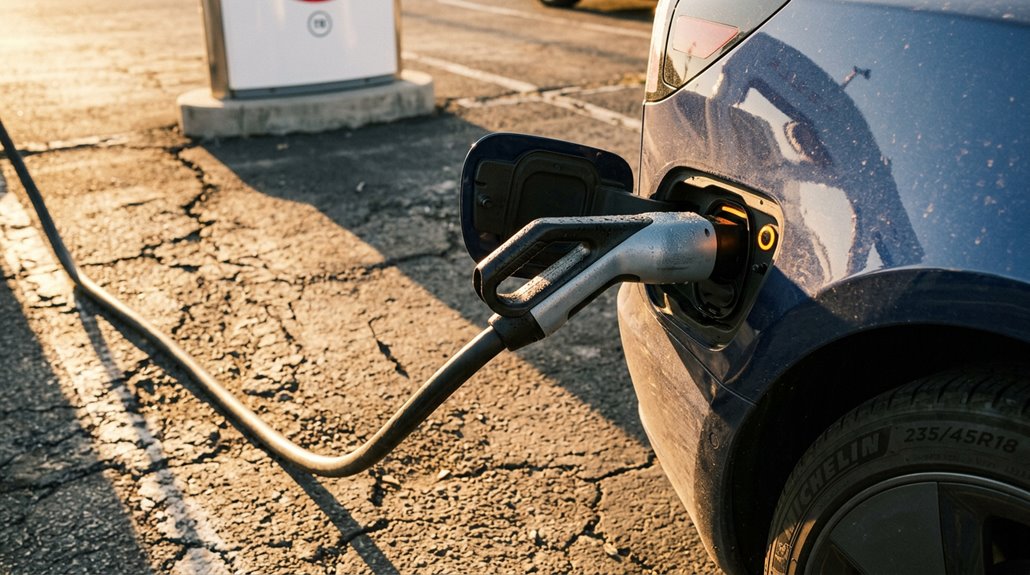
How Tesla’s DC Fast Charging Bypasses the Onboard AC Charger
When you plug into a Supercharger, something fundamentally different happens compared to plugging into a Wall Connector at home—direct current flows straight to your battery pack, completely sidestepping the onboard AC charger. That’s onboard bypass in practice.
At home, your Wall Connector delivers AC power, and the onboard charger converts it to DC before storage. That conversion takes time and caps your charge rate. Superchargers shift that work offboard entirely, handling external rectification through industrial-grade power electronics at the station itself.
The result? Power levels that dwarf anything a vehicle-mounted charger can process.
The Supercharger communicates directly with your vehicle, confirms compatibility through a handshake protocol, then delivers DC straight into the battery circuit—no conversion stage required. This makes Superchargers the ideal solution for long-distance travel, where minimizing downtime is critical.
Charging Curves Explained: What Happens From 0% to 100
When you plug into a Supercharger, the charging curve doesn’t behave like a flat line — power climbs fast in the low-SOC region (often hitting 100+ kW within the first few percent on a Model 3 or Model Y Long Range, and briefly spiking past 300 kW on a Cybertruck AWD around 12%–21% SOC), then settles into a strong mid-range plateau before the real slowdown begins.
That plateau, roughly between 10% and 80%, is where Tesla packs do their best work — the Model Y Long Range averages 96.3 kW across that window, completing the stretch in about 34 minutes.
Above 80%, the pack’s protection logic steps in hard, dropping output to around 27 kW at 96% and just 13 kW at 100%, which means the final 20% of charge can take nearly as long as the first 70%. For drivers focused on maximizing charging efficiency on longer trips, the optimum charge stop is around 44% SOC, delivering an effective average of 110.2 kW when factoring in a five-minute stop penalty.
Early Charge Phase Dynamics
Plug a Tesla into a Supercharger at near-zero state of charge, and the charging curve doesn’t simply leap to peak power—it climbs there, fast but deliberately. The voltage ramp up and battery conditioning both shape what happens in those first critical seconds.
- Charger handshake and BMS negotiation cause an initial ramp, not instant peak delivery
- A warm, preconditioned pack accepts current far more aggressively than a cold one
- Model Y Long Range data shows roughly 100 kW at 0%, climbing past 230 kW by 6% SOC
- Peak power (240–245 kW) typically arrives between 8–9% SOC under ideal conditions
- Cold cells restrict lithium-ion movement, meaningfully flattening that early climb
Battery conditioning isn’t optional—it’s the difference between peak performance and a sluggish session. Observed Cybertruck 4680 pack data shows an initial high-power phase that begins tapering around 20% state of charge, mirroring the same early-curve behavior seen in the Model Y 4680 charging profile.
Mid-Range Optimal Power
Once the battery climbs past that early ramp, something shifts—the pack settles into what most engineers quietly consider the most productive stretch of any Supercharging session. This is the mid range peak window, roughly 20% to 80% SOC, where charging ergonomics actually work in your favor.
Here the numbers get interesting. A 100 kWh Model S averages 129.0 kW from 10% to 80%, completing that stretch in about 31 minutes—adding 9.1 miles per minute (EPA cycle). A Model 3 manages 76.4 kW across the same band. That’s genuine range efficiency, supplying the best miles-per-minute ratio of the entire session.
Push past 80%, and tapering punishes your schedule. Stay within this band, and the Supercharger performs exactly as advertised. The Model 3 reaches its peak charging speed of approximately 169 kW around the 9% SOC mark before beginning a sustained decline through the mid-range window.
Tapering Above 80%
The battery management system doesn’t ease off the throttle past 80% out of stubbornness—it’s doing exactly what it’s designed to do. Cell balancing demands precision at high states of charge, and overvoltage damage is permanent.
The top-up psychology of “just a few more percent” costs more time than most drivers expect.
Here’s what’s actually happening above 80%:
- Constant-current charging gives way to constant-voltage mode
- Individual cells require tight voltage management to prevent damage
- Power can drop from 250+ kW to 20–40 kW near full charge
- The final 20% often matches the time spent charging from 20%–70%
- Effective miles-per-minute delivery slows dramatically
Unplugging at 80% on a road trip isn’t lazy—it’s mathematically smarter. Beyond the time penalty, frequent full charges to 100% and prolonged storage at full charge accelerate capacity degradation over the long term.
Model S, 3, X, Y, and Cybertruck Charging Curves Compared
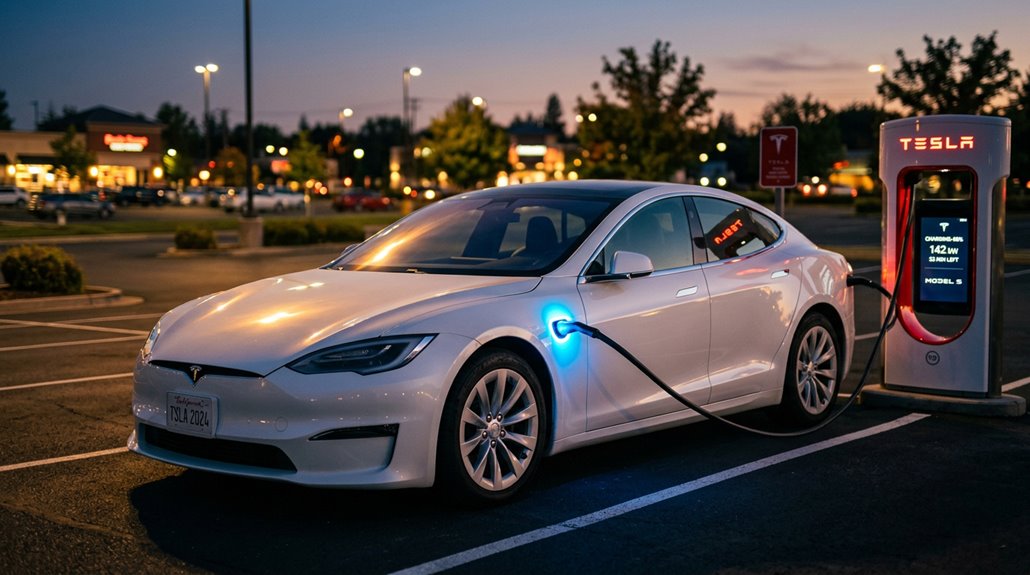
Every Tesla model follows the same fundamental charging logic—hit peak power early, then taper as the battery fills—but the *rate* at which each model executes that curve tells a more interesting story. Low SOC strategies differ meaningfully across the lineup. The Model S and X both reach 250 kW under ideal conditions, completing 10–80% in roughly 25–31 minutes. Model 3 front-loads power aggressively but tapers sooner past mid-range. Cybertruck covered 14–54% SOC in just 17.5 minutes, signaling a competitive early-session curve.
Thermal management ties everything together—a cold or stressed pack pulls peak power down regardless of model. The hardware ceiling matters less than battery temperature and entry SOC combined. A 2021+ Model S that never exceeds roughly 120–130 kW on a healthy V3 Supercharger after preconditioning and low SOC warrants further battery investigation.
How Battery Pack Size Changes the Charging Curve Shape
When you’re comparing Tesla charging curves across different pack sizes, the single most important variable isn’t peak kilowatts — it’s C-rate, which measures charging power relative to pack capacity (a 250 kW charge on an 82 kWh battery hits roughly 3.0C, confirmed by both InsideEVs and EVKX data).
Larger packs absorb that same 250 kW at a gentler relative stress level, which lets the BMS sustain a broader high-power plateau before taper kicks in — meaning more usable miles added before the curve bends downward.
Smaller packs, by contrast, reach high C-rates sooner, prompting earlier and steeper taper to protect cell longevity, which produces that characteristically “spiky” curve shape: strong early output, faster slowdown later. The 2019 Model 3 LR completed the 20–80% SOC window in roughly 22 minutes compared to 31 minutes for the 2021 version, despite both cars accessing the same 250 kW peak power at the V3 Supercharger.
Larger Packs, Longer Curves
Pack size doesn’t just change how much energy a Tesla can store—it fundamentally reshapes the entire charging curve. Larger packs benefit from superior battery distribution, spreading incoming power across more cells through energy diffusion that prevents premature tapering.
Here’s what the data actually shows:
- BTX6 (S/X100, 95.7 kWh usable) maintained strong charging across a broad SoC range
- BTX6 was frequently Supercharger-limited at 120 kW, not pack-limited
- BTX4 and BTX6 follow similar curve families, but BTX6 sustains higher absolute power
- S70 began tapering around 25% SoC—earlier than virtually every other pack
- Bigger packs show less dramatic power decline at equivalent displayed SoC percentages
Simply put: more capacity buys you a flatter, longer, more forgiving curve. The data behind these findings came from over 4,600 Supercharging sessions recorded across 801 Tesla owners, giving the charging curve analysis a substantial real-world foundation.
Taper Timing By Capacity
Bigger packs don’t just delay the taper—they move the whole curve. Capacity timing determines where high-power charging ends, not just how long it lasts. A Model S 70, for instance, begins tapering around 25% SOC—before most drivers even consider stopping. Larger packs typically sustain peak power until roughly 50% SOC, giving you a meaningfully wider fast-charging window.
Taper mechanics work like this: smaller or older packs spend a disproportionate share of any 20%–80% session already in reduced-power territory. Two vehicles showing identical peak kilowatts can still deliver completely different 10%–80% completion times. CleanTechnica’s aggregated data across 4,600 Supercharging sessions confirmed this variation clearly. Pack size shapes the curve’s blueprint—not just its endpoint. If charging behavior seems inconsistent or data fails to load, JavaScript must be enabled in your browser to access live session tools and resources properly.
LFP vs. NMC: Why Charging Curves Look Different
Though both LFP and NMC packs move electrons in and out of lithium-based cells, their charging curves behave so differently that you’d almost think they’re from separate technological eras. The core difference comes down to voltage behavior.
- LFP’s voltage plateau sits stubbornly flat (3.2–3.3V/cell) from roughly 10–95% SOC
- That flatness makes SOC display less accurate without periodic LFP calibration at 100%
- NMC climbs more gradually from 3.0–4.2V/cell, giving the BMS clearer charge-level feedback
- NMC’s lower charge tolerance at high SOC means daily 80% limits protect longevity
- LFP handles regular 100% charging without meaningful degradation — actually needing it for accuracy
You’re effectively choosing between chemistry that communicates clearly versus chemistry that stays resilient. At the pack level, LFP’s cost per kWh runs roughly 15–25% cheaper than NMC, which is why automakers lean on it for value-focused trims while still delivering competitive range figures.
Why Charging Slows Above 80% State of Charge
If you’ve ever watched your Tesla’s charging rate drop sharply after hitting 80% state of charge (SOC), you weren’t imagining a glitch — you were watching a deliberate, physics-driven protection system kick in.
Your battery management system (BMS) triggers a shift from constant-current (CC) to constant-voltage (CV) charging around 70–80% SOC, holding voltage near its upper safe limit while progressively cutting current to prevent lithium plating on the anode (an irreversible reaction that permanently shrinks usable capacity).
That last 20% takes disproportionately longer not because the charger is underperforming, but because the BMS is simultaneously managing overvoltage risk, cell balancing across hundreds of individual cells, and thermal stress — all of which demand slower, more controlled energy delivery at high SOC. Real-world data from Tesla Model Y charging sessions confirms that all three variants hit a clear power ceiling at this threshold, with charging power dropping significantly above 80% SOC.
Battery Protection Mechanisms
When you watch your Tesla’s charging rate drop off above 80% state of charge, you’re witnessing the battery management system (BMS) doing exactly what it’s designed to do—protect the pack from electrochemical stress that compounds quickly near full charge.
The BMS enforces this slowdown through several active mechanisms:
- Voltage monitoring tracks individual cell voltages in real time, flagging dangerous spikes
- Cell balancing redistributes energy across uneven cells to prevent overvoltage
- Reduced charge rates limit heat generated by internal resistance
- Electrolyte oxidation risk drops markedly when voltage stays controlled
- Weaker cells get protected before they reach damaging thresholds
Think of it as precision traffic control—the BMS keeps every cell moving safely through the most electrochemically stressful stretch of the charging curve. This protection is especially relevant during Supercharging sessions, where Tesla specifically recommends stopping at 80% to prevent excessive heat buildup that high-speed charging generates at elevated states of charge.
Taper Rate Explained
Watch the charging rate on your Tesla’s screen during a Supercharging session and you’ll notice something counterintuitive: the closer you get to a full battery, the slower the charge becomes—not because the charger is struggling, but because the battery management system is deliberately pulling back. That’s taper behavior at work. The voltage interplay between lithium-ion cells and incoming current tightens markedly above 80% SOC, forcing the BMS to reduce amperage to prevent cell stress.
| SOC Range | Charging Behavior |
|---|---|
| 10–50% | Maximum power delivered |
| 50–80% | Gradual power reduction begins |
| 80–90% | Noticeable slowdown |
| 90–95% | Significant rate drop |
| 95–100% | Near-trickle speed |
Plan road trip stops around 80%—that final 20% costs disproportionate time for minimal added range. V3 Superchargers deliver up to 250 kW of peak power, meaning the early charging window before tapering begins is where you capture the most meaningful speed advantage on long-distance trips.
Optimizing Charge Sessions
Grasping why your Tesla charges slower above 80% comes down to a straightforward electrochemical reality: lithium-ion cells can only safely accept current up to a specific voltage ceiling, and as state of charge climbs, the pack creeps closer to that limit. Your BMS shifts from constant-current to voltage-limited behavior, throttling power automatically.
Smart charge etiquette accounts for this physics:
- Set your daily cap to 80% for routine charging
- Reserve 100% charges for immediate departure, not overnight parking
- Plan Supercharger stops in the 20%–70% range for maximum speed
- Avoid prolonged high-SOC storage, which accelerates chemical side reactions
- Skip deep discharges near 0%, since both extremes stress cells
The vehicle controls the slowdown—not the charger. On a road trip, arriving low and leaving around 60–75% rather than waiting for a fuller charge can deliver faster overall trip times.
The Battery Science Behind Why Fast Charging Slows Down
If you’ve ever watched a Tesla’s charging rate drop from 250 kW down to something that looks embarrassingly slow near 90%, you’ve witnessed battery electrochemistry doing exactly what it’s designed to do.
Lithium-ion cells charge aggressively in constant-current mode between 0% and roughly 60%, where cells safely absorb high current. Beyond that, voltage rises and the system shifts to constant-voltage control, forcing current to taper. Push too hard here and you risk lithium plating—metallic lithium depositing on the anode surface instead of integrating properly into graphite. That’s a permanent problem.
Rapid charging also causes electrode expansion as reaction byproducts clog internal pores, blocking ion movement. The slowdown isn’t a software glitch; it’s physics protecting your investment.
Research from Argonne National Laboratory found that repeated fast charging causes atomic lattice distortion at graphite particle edges, which prevents lithium ions from finding proper intercalation sites and forces them to plate on the surface instead.
How Battery Temperature Affects Peak Charging Rate
State of charge isn’t the only thing standing between your Tesla and a full-speed charge session—temperature runs the show just as much, and sometimes more. Battery thermals directly control how aggressively your pack accepts current.
Here’s what that looks like in practice:
- Ideal fast-charging sits near 32°C (roughly 90°F)
- Cell temps rising from 104°F to 109°F can still hold ~94 kW
- The practical charging cutoff triggers around 113°F
- Above ~40°C, degradation accelerates—roughly doubling every 10°C
- Charging below 0°C risks lithium plating and poor acceptance
Your BMS constantly balances speed against cell health. When heat builds faster than liquid cooling removes it, power tapers—regardless of your SOC. Real-world sessions confirm that charge rate dropped progressively from 94 kW down to roughly 69 kW as the pack climbed from 60% to 70% state of charge under thermal load.
What Is Battery Preconditioning and Why It Matters?
Battery preconditioning is exactly what it sounds like: your Tesla actively heats or cools the high-voltage pack before you charge or drive, pulling the cells into their ideal operating window (typically 65–95°F) so they can accept maximum current without the BMS throttling the charge rate.
A cold lithium-ion cell has higher internal resistance, which forces the Supercharger to back off from its peak output—sometimes dramatically, cutting V3’s 250 kW ceiling down to a fraction of that on a bitter January morning.
Guide to a Supercharger through Tesla’s built-in nav, though, and the car starts preconditioning automatically en route, so you arrive with a pack that’s ready to pull full power instead of spending the first ten minutes of your charge session just warming up.
Beyond charging, preconditioning also restores the battery’s chemical reaction efficiency in cold weather, directly maximizing driving range before you even leave home.
How Preconditioning Works
When your Tesla’s battery is too cold or too hot, it can’t accept charge efficiently—and that’s exactly the problem preconditioning solves.
Tesla’s thermal management system continuously monitors pack temperature, then applies heating or cooling through dedicated coolant loops to hit that ideal window (roughly 68–86°F). That’s battery conditioning working quietly in the background. A cold-soaked pack can start a DC fast charge session at 2–3× lower power than a properly preconditioned one.
Thermal scheduling handles the timing automatically:
- Routing routes to a Supercharger trigger automatic preconditioning
- Scheduled Departure activates the system 30–60 minutes before departure
- Grid power (when plugged in) handles the heating load, not your range
- Coolant loops circulate heated or cooled fluid around the cells
- Some heat pump-equipped models recover ambient heat more efficiently
The result? Your pack arrives at the charger already primed, not playing catch-up.
Temperature’s Role in Charging
Temperature dictates nearly everything about how fast your Tesla accepts a charge—and lithium-ion chemistry is the reason why. Cells operate best between 60–95°F (15–35°C). Outside that window, electrochemical reactions slow, internal resistance climbs, and your charging speed drops accordingly.
Cold weather is the bigger culprit—below freezing, ion movement through the electrolyte becomes sluggish, forcing the battery management system to throttle incoming power markedly. High heat creates its own problems, triggering conservative limits to protect long-term cell health.
This is exactly why thermal management exists: keeping the pack within that productive temperature band matters as much as the charger’s output rating. Battery preconditioning addresses this directly by warming (or cooling) the pack before you even plug in, so chemistry does its job efficiently from the first kilowatt. For best results, begin preconditioning 30–45 minutes before arriving at a Supercharger, or at least 45 minutes ahead in cold temperatures.
Benefits for Charging Speed
Preconditioning is, simply put, active thermal management of your traction battery before you plug in—heating or cooling the pack so it arrives at the charger already inside that productive 15–35°C (60–95°F) window. Cold charging without it means the battery reluctantly accepts power at reduced rates, costing you dwell time. Smart departure timing fixes that.
The practical wins stack up quickly:
- Higher peak charging rates from the moment you plug in
- Shorter total charger dwell time, especially on multi-stop road trips
- Better capture of low-SOC charging speeds (where rates are naturally highest)
- Reduced battery strain by avoiding aggressive fast charging from a cold state
- Greater charging consistency across back-to-back winter stops
Precondition properly, and the charger works with your pack instead of fighting it. Tesla’s heat pump and octovalve work together to scavenge heat from powertrain components, directing it into the battery pack during the approach to a charger.
How Tesla’s Navigation Triggers Preconditioning Automatically
Setting a Supercharger as your destination is all it takes — Tesla’s route guidance system takes over from there, automatically initiating battery preconditioning without any additional input from you. The car reads your planned route, calculates arrival optimization based on distance and live consumption data, and determines precisely when thermal preparation should begin.
Set a Supercharger as your destination — Tesla handles the rest, automatically preconditioning your battery without any input from you.
Route timing typically kicks off preconditioning 20–45 minutes before you arrive, though cold weather or a deeply cold-soaked pack pushes that window earlier.
The system isn’t working from a fixed timer — it’s continuously adjusting based on terrain, speed, and conditions. On multi-stop trips, each Supercharger destination triggers its own preconditioning sequence.
Third-party route apps, however, won’t reliably activate this feature, so Tesla’s native routing remains your most dependable option.
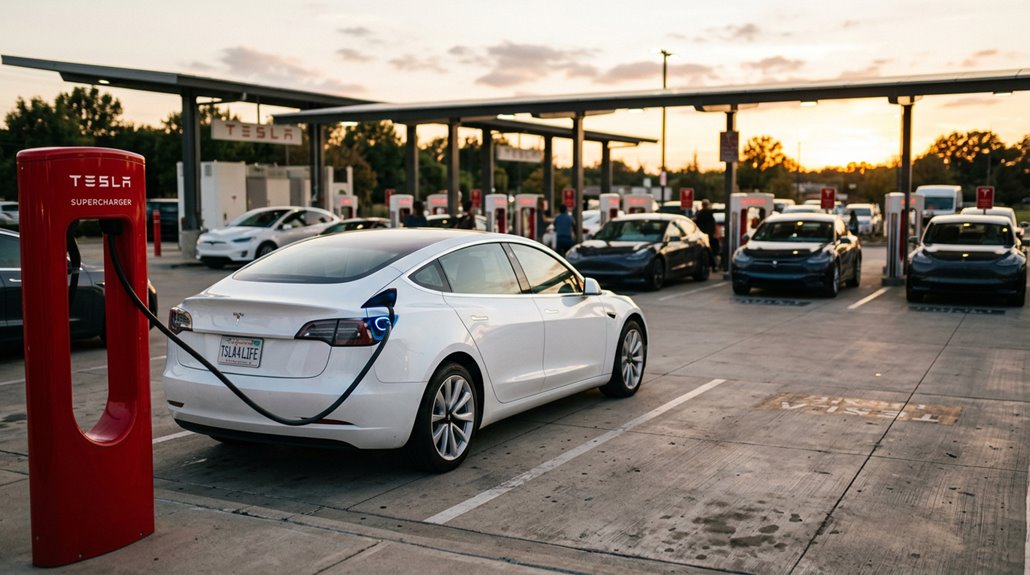
How One Supercharger Cabinet Splits Power Between Two Stalls
Sharing power sounds like a compromise — and honestly, sometimes it is. Older V1/V2 sites run one cabinet across two stalls, meaning you’re splitting available output with whoever parks beside you.
Here’s how that split actually works:
- First vehicle connected typically claims the larger share
- Allocation shifts responsively as demand changes between stalls
- Light charging on one side frees capacity for the other
- Some sites use A/B user signage to identify paired stalls
- Cabinet diagnostics track module reassignment in real time
V3 scaled this up — one cabinet serves up to four posts, rated around 350 kW. The logic stays consistent: shared infrastructure, smarter distribution.
Real-world impact hits hardest during peak hours when both stalls demand maximum power simultaneously.
What the Site Pop-Up kW Rating Actually Tells You
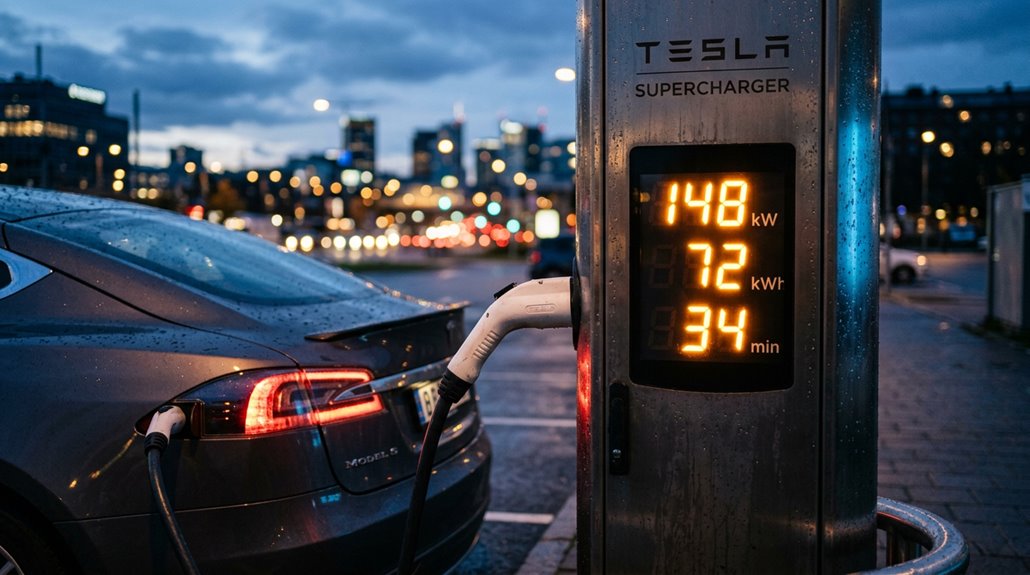
When you tap a Supercharger stall on Tesla’s in-car map or the PlugShare pop-up, that kW figure (72 kW, 150 kW, 250 kW, or 500 kW) tells you the charger’s rated maximum output ceiling, not what your battery will actually pull at any given moment.
Real-time conditions like site-level load sharing, cable thermal limits, and how many stalls are active can shave that ceiling down before your car even negotiates its own BMS limits.
Your actual charge rate is always the lower of what the site can deliver and what your pack will accept, so treat that pop-up number as a useful filter for picking the right stop, not a guaranteed speed.
Maximum Available Power
That kW number displayed in the Tesla app’s site pop-up tells you the station’s maximum power ceiling, not what your car will actually pull during a session.
Think of it as the station’s resume, not a performance guarantee.
Here’s what that rating actually reflects:
- V1 stations cap at 90–120 kW total output
- V2 stations push peak delivery up to 150 kW
- V3 stations reach 250 kW under ideal conditions
- V4 hardware references 350 kW and beyond
- Vehicle limits always override station capability
Your Model 3 won’t magically absorb 250 kW just because the station offers it.
The pop-up identifies charging tier and hardware class—treat it as a ceiling, never a promise.
Real-Time Site Conditions
The site pop-up kW figure you see in the Tesla app or touchscreen isn’t a live readout—it’s a stamped specification for the location’s installed infrastructure, full stop.
Real-time diagnostics don’t feed into that number. Stall occupancy, thermal monitoring of active battery packs, and even network latency between Tesla’s servers and your vehicle all stay invisible behind that single rating. What you’re reading is effectively a nameplate, not a dashboard.
Actual Charging Variability
Seeing “250 kW” on a Supercharger site pop-up feels like a promise, but it’s really just a ceiling—and your car decides whether it gets anywhere near that ceiling. That number reflects site-level equipment capacity, not your guaranteed delivered power. Charge variability is real, and grasping it reshapes session planning from guesswork into strategy.
Here’s what actually shapes your charging rate:
- Battery state of charge — peak power hits briefly near 10% SoC, then tapers
- Pack chemistry — LFP, NCA, and NCM cells each accept power differently
- Ambient temperature — cold packs throttle acceptance rates considerably
- Vehicle design — Model Y Performance peaks around 230–245 kW; RWD variants run slower
- Average delivered power — typically around 100 kW, even at 250 kW sites
How V3 Superchargers Deliver Up to 250 kW Per Vehicle
At the heart of V3 Supercharging sits a 1 MW power cabinet — roughly the output of a small wind turbine — that fundamentally rethinks how electrons reach your battery. Unlike V2’s shared-cable blueprint, V3 uses dedicated power delivery per stall, enabling true power sharing across connected vehicles without bottlenecking individual sessions.
| Metric | V3 Supercharger |
|---|---|
| Cabinet Output | 1 MW |
| Max Per Vehicle | 250 kW |
| Peak Availability | Low-SoC sessions only |
Thermal management plays an equally critical role. Your battery’s temperature directly gates how aggressively it accepts current — push too hard against a cold or saturated pack, and the system responsibly tapers output. That 250 kW ceiling isn’t guaranteed; it’s earned through ideal conditions.
How V4 Superchargers Scale to 500 kW for Passenger Cars
V3’s 250 kW ceiling was impressive for its time, but Tesla didn’t stop there — V4 hardware doubles that figure to 500 kW per stall for passenger vehicles, and the physics behind that leap matter more than the headline number. Higher voltage means more power at the same current, which is where 800V scaling becomes essential.
- V4 posts support up to 1,000 volts
- Cybertruck’s 800V pack uses that range natively
- Standard 400V vehicles can’t fully exploit the stall rating
- One V4 cabinet powers up to eight stalls
- Cables run longer, reaching more charge-port positions
Thermal management keeps those sustained rates stable — without it, 500 kW becomes a momentary spike rather than a usable curve. Real sites in California, Utah, and Florida confirm this hardware is live.
How V4 Superchargers Support Commercial EV Charging Needs
While 500 kW per stall grabs the headlines, the commercial rollout model behind V4 hardware is what actually makes it viable at scale. Tesla’s Supercharger for Business program lets property owners purchase V4 hardware outright — roughly $940,000 all-in for an eight-stall site — while Tesla operates the network. You’re looking at fleet depots, retail hospitality venues, travel centers, and roadside properties as the primary targets.
One cabinet handles up to eight posts and delivers a shared 1.2 MW total output, which also covers Tesla Semi charging. Tesla charges operators a flat $0.10/kWh network fee, keeping billing straightforward. Multi-standard support (NACS, CCS1, CCS2, GB/T, MCS) means you’re not limiting access to Tesla drivers only, which matters enormously for high-utilization commercial sites.
The Role of 800V Architecture in Faster Charging
Higher voltage isn’t just a spec sheet flex — it’s the physics reason some EVs charge dramatically faster than others. Using Power = Voltage × Current, an 800V system delivers the same kilowatts with roughly half the current of a 400V system, and that difference compounds quickly.
Higher voltage isn’t a spec sheet flex — it’s the physics behind why some EVs charge dramatically faster than others.
- Lower current means fewer I²R losses (heat scales with current squared
- Thermal benefits include reduced cooling demands during high-power sessions
- Wiring savings come from thinner, lighter conductors throughout the vehicle
- 800V adoption pushes 10–80% charge times toward 15–20 minutes on capable chargers
- Charging infrastructure must support 350 kW delivery — otherwise, the voltage advantage largely disappears
The design only functions when the charger matches the vehicle’s capability.
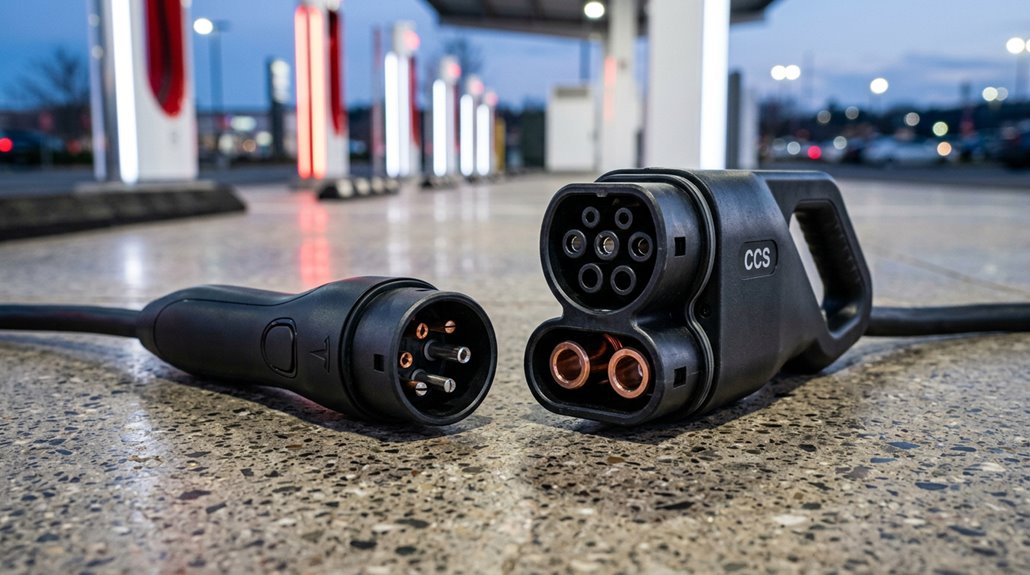
NACS vs. CCS: Connector Design and Why It Changes Charging Performance
Choosing between NACS and CCS isn’t just a branding debate — it’s a question of engineering philosophy that directly affects how reliably and comfortably you charge.
NACS uses a compact 5-pin design that multiplexes AC and DC through the same interface, shrinking the vehicle-side inlet and improving connector ergonomics dramatically.
You’ll notice the difference immediately: NACS connects one-handed, while CCS — bulkier, heavier, with a handle-side plastic latch — demands more effort, especially in freezing temperatures.
Durability comparisons favor NACS here, since fewer moving parts on the handle side means fewer failure points.
CCS relocates its latch to the handle, where wear and cold exposure accelerate breakage.
Industry momentum has since shifted toward NACS standardization, and honestly, the engineering explains why.
Long trips expose a simple reality most Tesla owners only notice once charging plans start falling apart — Superchargers aren’t always nearby, and hotel or rural stops can slow things down fast. Portable Tesla-Compatible Level 2 Travel Charger gives you a reliable overnight charging option when fast charging isn’t practical, keeping range topped up without relying on station availability or timing.
How Non-Tesla EVs Access Superchargers With and Without Adapters
Whether you need an adapter depends entirely on your car’s charge port—native NACS-equipped vehicles (like the 2026 Lexus RZ or newer Ioniq models) plug directly into compatible V3 and V4 Supercharger stalls without any hardware middleman, while older CCS-equipped EVs require a manufacturer-approved CCS-to-NACS adaptor before the network even recognizes your session.
Ford, GM, Rivian, Hyundai, Kia, BMW, Audi, Volkswagen, Volvo, and Mercedes-Benz have all either announced or launched Supercharger access programs, each setting its own eligibility rules, supported model years, and adapter ordering process.
Even with the right port or adapter in hand, access isn’t universal—non-Tesla charging runs exclusively through V3 and V4 hardware at approved sites, so confirming compatibility through the Tesla app or a third-party tool like PlugShare before you pull in isn’t optional, it’s just smart planning.
Supercharging sessions give you speed and convenience, but they don’t really tell you what’s happening beneath the surface of your battery over time—temperature shifts, charging patterns, or early signs of efficiency changes. OBD2 Bluetooth Battery Monitor for EV Diagnostics adds a layer of real-time insight into those hidden details, helping you understand how your Tesla is responding during charging and everyday driving.
NACS Compatibility Explained
The Tesla Supercharger network didn’t open its doors to non-Tesla EVs overnight—it rolled out in stages, and the hardware and software requirements depend heavily on which connector your vehicle speaks natively.
Here’s what shapes your access:
- Native NACS (SAE J3400) means you plug in directly—no adapter logistics required
- CCS1 vehicles need a manufacturer-approved adaptor to connect physically
- Magic Dock stations provide built-in adaptor support at select locations
- Software authorization must clear before charging begins, regardless of hardware fit
- Not every stall qualifies—Tesla’s map flags compatible sites as “Superchargers Open to NACS”
Hardware gets you connected. Software authorization gets you charging.
Both conditions must be met, and your automaker’s integration with Tesla’s network finally determines whether that session actually starts.
Adapter Requirements By Brand
Most non-Tesla EVs sitting in your driveway right now fall into one of two camps: they either need a CCS-to-NACS converter to plug into a Tesla Supercharger, or they ship with a native NACS port and skip the converter step entirely.
Ford, GM, Hyundai, Kia, Mercedes-Benz, Honda, and Porsche all require converter sourcing through brand-approved dealer channels or manufacturer apps—not random third-party hardware (warranty impacts are a real concern there).
Lexus RZ models with factory NACS ports bypass this entirely.
Magic Dock stalls handle CCS1 vehicles without converters at select locations, though this network subset stays small.
Always confirm site eligibility through the Tesla app before driving anywhere, because converter in hand doesn’t guarantee every stall accepts your vehicle.
Plug and Charge: How Automatic Session Authentication Works
Plugging in kicks off more than just a power connection—it triggers an encrypted authentication handshake between your EV and the charging station, handled entirely through ISO 15118, the international standard defining secure vehicle-to-grid communication. No app, no RFID card, no QR code. Your vehicle identity speaks for itself through digital certificates.
Here’s what happens automatically:
- Certificate lifecycle validates your EV’s OEM-provisioned digital identity
- Contract linkage ties your charging agreement directly to the vehicle
- Backend authorization confirms entitlement before a single kilowatt flows
- Both station and EV must natively support ISO 15118 for this to work
- One-time registration activates all future hands-free sessions
Authentication friction disappears. Errors from lost cards or failed apps become irrelevant.
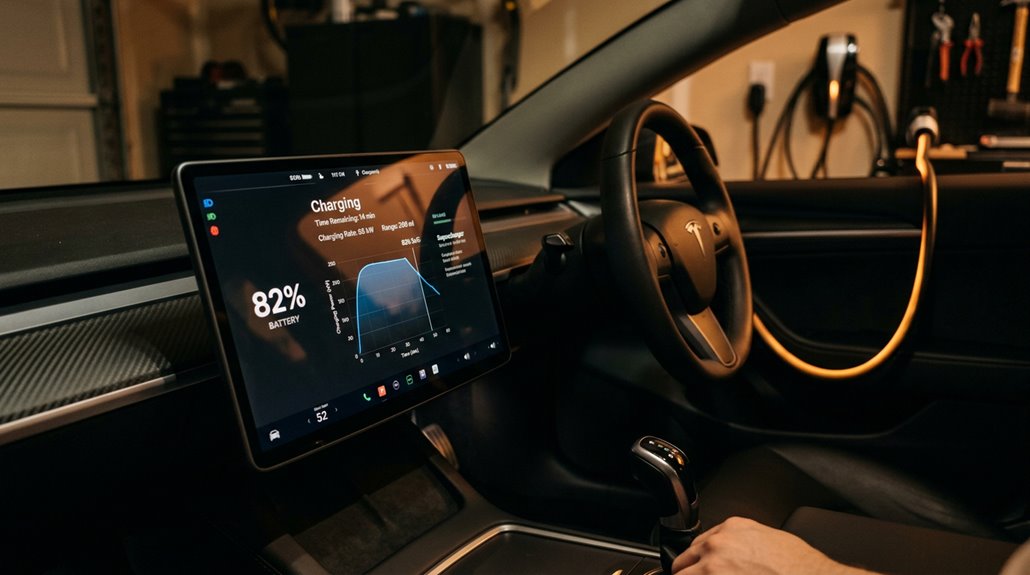
How Tesla’s Charging App Monitors and Controls a Live Session
Authentication handles the invisible handshake—but once your session’s live, you’ll want to actually see what’s happening without standing next to your car staring at the charge port light. Tesla’s iOS app (version 4.45.0 or later) delivers real time telemetry directly to your Lock Screen and adaptive Island through Apple’s Live Activity framework, requiring iOS 17.2 minimum.
The session controls surface everything that matters: state of charge, charging power in kilowatts, estimated session cost, range added, and time remaining—all updating automatically, no manual refresh required. Your vehicle image even reflects your colorizer setting. Older iPhones without adaptive Island still receive Lock Screen updates, so no one’s left guessing. Currently, Live Activity covers Supercharging only; home charging and third-party DC fast chargers aren’t supported yet.
Supercharger Idle Fees: How They Work and How to Avoid Them
Once your session ends, the clock starts—and Tesla’s idle fee system is the mechanism that keeps Supercharger stalls from turning into free long-term parking. You get a 5-minute grace period, then idle penalties kick in based on station occupancy.
Here’s what drives the fee structure:
- 50% site occupancy triggers the base rate (~$0.50/min)
- 100% occupancy can double that rate to ~$1.00/min
- One idle hour at full occupancy costs roughly $60
- App notifications alert you when charging completes
- Low-occupancy stations may waive fees entirely
Smart grace management means monitoring your session actively and returning promptly. Tesla’s occupancy-linked logic is deliberate—it punishes stall-blocking where it actually hurts availability.
Supercharging Costs: Per-kWh vs. Per-Minute Billing Explained
At the Supercharger stall, two different billing systems determine what you actually owe—and they don’t produce the same number.
Per-kWh billing charges for actual energy delivered, making energy comparison straightforward: you pay roughly $0.30–$0.45/kWh across most U.S. locations. That’s clean math.
Per-minute billing introduces billing variability because your cost depends on charging speed, battery state, and how aggressively your pack tapers near full. Per minute fairness heavily favors faster-charging vehicles—slow taperers effectively subsidize everyone else.
Session optimization matters here: stopping before your car throttles its charge rate saves real money under minute-based pricing.
Home charging typically runs $0.12–$0.18/kWh, so Supercharging (even at its best) costs considerably more.
Knowing which billing model your station uses before you plug in isn’t optional—it’s just smart.
Free Supercharging Agreements: What They Cover and What They Don’t
Free Supercharging covers one thing specifically: charging fees at Tesla’s own Supercharger network, so don’t expect it to offset your home electricity bill, your ChargePoint sessions, or any third-party DC fast charger costs.
Whether your agreement is VIN-locked (the strongest variant, surviving private resale), account-locked (tied to your Tesla profile and effectively worthless to a future buyer), or time-limited (three months, one year, whatever the promo window specifies), the underlying coverage stays the same — Supercharger fees only.
Idle fees, congestion surcharges, and any commercial-use scenarios like rideshare or paid transport typically fall outside the agreement’s scope, so read the fine print at delivery rather than uncovering the exclusions at a charging station.
What Free Supercharging Covers
Grasping exactly what Tesla’s free Supercharging agreements actually cover saves you from some genuinely unpleasant billing surprises down the road. At its core, the benefit targets energy dispensed at Tesla-owned Supercharger stalls — nothing broader.
Here’s what typically falls within coverage:
- Energy costs waived during qualifying charging sessions at Tesla Supercharger locations
- Benefit periods beginning at vehicle delivery and running continuously from that date
- Eligibility verification through your Tesla account, which displays your Supercharging status clearly
- Stackable credits from separate promotions, such as trade-in mileage-based Supercharging allowances
- Transferability limits defined by whether your agreement carries SC01 (transferable) or SC05 (owner-locked) status codes
Understanding those two codes alone prevents costly assumptions when buying or selling your vehicle.
Key Exclusions Apply
While knowing what free Supercharging covers is genuinely useful, the exclusions are where the real money lives. Transfer limits catch buyers off guard constantly. VIN-tied perks can survive a private sale, but account-locked lifetime Supercharging typically doesn’t follow the car anywhere. Once you transfer ownership, that benefit disappears.
Owner restrictions add another layer. Commercial use—ride-hailing, fleet operations, any business application—voids most promotional offers outright. Tesla reserves the right to pull free Supercharging for excessive charging patterns too.
Location matters as well. Free Supercharging applies at Tesla-owned Superchargers specifically, not every fast charger wearing Tesla branding. Third-party-operated sites set their own pricing rules. Congestion fees can still hit your bill even when the charging energy itself costs nothing.
Route Planning With Supercharger Stops Built Into Navigation
Tesla’s route-planning system almost always handles the heavy lifting when you’re planning a long trip — enter your destination on the touchscreen, and the system automatically calculates a route, identifies where your battery will fall short, and inserts Supercharger stops directly into your turn-by-turn directions.
Each stop is fine-tuned for corridor routing, minimizing total time spent driving and charging combined. Proper charging etiquette means not overstaying your allotted stop time.
- Recommended charge times display per stop
- Estimated energy remaining shows on arrival
- Stops can be removed or re-added anytime
- Real-time traffic adjusts arrival estimates automatically
- The lightning bolt icon locates nearby Superchargers instantly
You stay informed, in control, and moving efficiently.
How Tesla Predicts Your Battery Level at Each Charging Stop
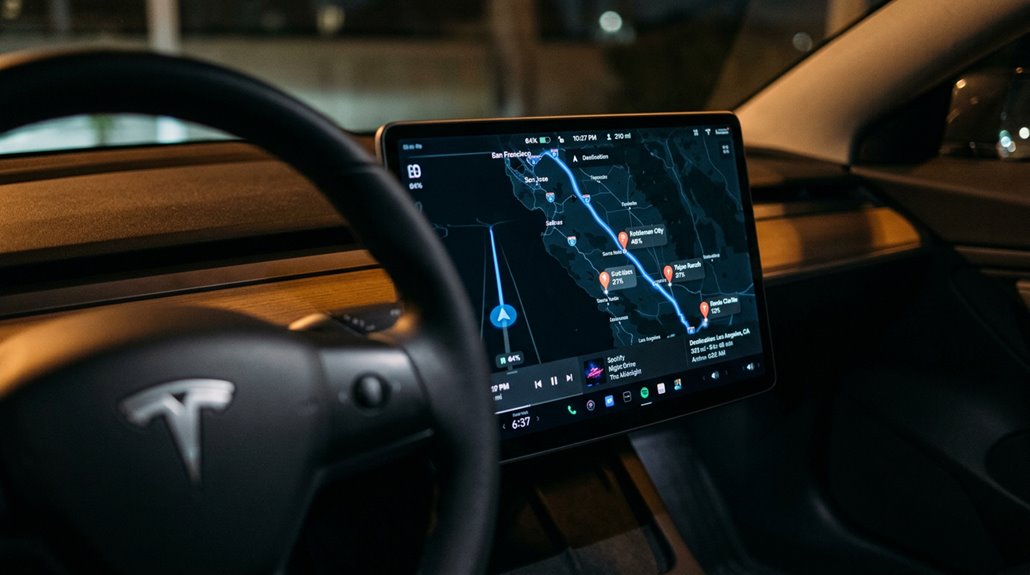
Behind every Supercharger stop Tesla inserts into your route is a live energy forecast — not a guess, but a continuously recalculated prediction built from real-world inputs. Your arrival prediction pulls from driving style, elevation changes, wind speed, air density, humidity, and forecasted temperature. That’s not a static calculation — it updates constantly as your actual consumption diverges from the plan.
Yellow warnings signal critically low arrival energy; red means you need a charge before reaching that stop. The Energy app lets you compare actual usage against the trip projection, which sharpens future accuracy. Energy forecasting improves as the system learns your specific driving patterns, making estimates more tailored over time — though battery degradation and unexpected speed changes can still introduce variance.
Optimal Charging Stop Duration to Minimize Total Trip Time
Spending more time at a Supercharger than you actually need is one of the easiest ways to turn a manageable road trip into an endurance test. Smart trip pacing means treating charge targets like fuel strategy, not anxiety management. Dwell optimization lives in the middle of the battery, not the top.
Treat charge targets like fuel strategy, not anxiety management. Dwell optimization lives in the middle of the battery, not the top.
- Arrive between 8%–12% SoC for maximum short stops efficiency
- Target departure around 55%–65% on V3/V4 hardware
- Avoid charging above 80% unless gaps between stations demand it
- Two brief stops often beat one long session mathematically
- The final 20% frequently consumes disproportionate dwell time relative to range gained
Stay in the fast-charging zone. That’s where minutes actually work for you.
Does Frequent Supercharging Hurt Your Tesla Battery?
Frequent Supercharging gets a bad reputation it largely doesn’t deserve—a Recurrent analysis of 12,500+ Tesla vehicles found no statistically significant difference in battery degradation between frequent and infrequent Supercharger users.
Tesla’s battery management system (BMS) actively throttles charging current based on temperature, state of charge, and pack age, meaning the raw power of a V3 Supercharger (up to 250 kW) doesn’t translate directly into accelerated cell wear under normal conditions.
The real degradation risks come from specific conditions—repeated fast-charge sessions in extreme heat, charging without cold-weather preconditioning, or habitually topping non-LFP packs above 90%—rather than Supercharging frequency alone.
Supercharging Battery Degradation Risks
One of the most common concerns Tesla owners bring up is whether hammering the Supercharger network regularly will quietly destroy their battery pack over time — and the short answer is that the evidence doesn’t really support that fear.
Recurrent’s 12,500-vehicle dataset found no statistically meaningful degradation difference between frequent Supercharger users and Level 2 regulars. Good charge etiquette and grasping your battery chemistry matter far more than frequency alone.
Real degradation culprits include:
- Sustained high state of charge (parking at 100% daily)
- Elevated temperatures above 40°C during charging
- Cold-weather fast charging without preconditioning
- Repeated sessions in ambient heat exceeding 100°F
- Charging at extreme SOC ranges (very low or very high)
Protecting Longevity Through Limits
Whether Supercharging quietly kills your Tesla battery is one of those questions that sounds reasonable until you actually look at the data. Recurrent analyzed over 12,500 U.S. Teslas and found no statistically significant degradation difference between heavy and rare Supercharger users.
Your battery management system deserves most of the credit — it actively tapers current as state of charge climbs and manages thermal load throughout the session. Real charging etiquette matters more than the charger label itself. Parking consistently at 100% stresses cells harder than occasional DC fast charging ever will. Tesla’s own battery limits guidance confirms that charge rate may slow slightly over time, adding only a few minutes per session — barely a rounding error across years of ownership.
Heat And Charging Cycles
Heat is the real villain here, not the Supercharger itself. Recurrent’s analysis of 12,500+ Tesla vehicles found virtually no statistical difference in degradation between drivers who Supercharge 90% of the time versus those who rarely do. Tesla reports roughly 12% capacity loss after 200,000 miles regardless.
What actually matters is thermal cycling quality:
- Sustained high temperatures during charging accelerate cell aging
- High state-of-charge combined with heat creates the most demanding conditions
- Cold-weather fast charging risks lithium plating without preconditioning
- Multiple daily charges (Uber-style use) accumulate heat stress faster than occasional road-trip sessions
- Charging etiquette like avoiding 100% holds reduces post-charge thermal stress
Tesla’s battery management system quietly handles most of what your charging habits throw at it.
How DC Fast Charging Frequency Affects Long-Term Battery Health
Occasionally relying on a Supercharger is one thing—building your entire charging routine around DC fast charging is another, and the data suggests your battery notices the difference.
Frequency impacts cumulative wear more than any single charging event. Geotab analyzed 22,700 EVs and found vehicles using DC fast charging for under 12% of sessions averaged roughly 1.5% annual degradation. Push that above 12%, and degradation climbs to around 2.5%.
Power level compounds the problem—vehicles regularly exceeding 100 kW for over 40% of sessions hit approximately 3.0% annual degradation.
Curiously, Recurrent’s 13,000-Tesla study found no statistically significant difference, suggesting Tesla’s battery management system partially cushions the blow.
The practical takeaway: use Level 2 AC for daily charging and reserve Supercharging for road trips.
Two Ways Tesla Batteries Age: and Which One Matters More
Tesla batteries don’t just wear out from use—they also age simply from existing, and grasping the difference between these two mechanisms shapes every smart ownership decision you’ll make.
Calendar aging happens with time alone. Cycle aging accumulates through repeated charging and discharging.
Here’s what actually drives each:
- Calendar aging worsens under heat and high state-of-charge storage
- Cycle aging intensifies with deeper discharge cycles
- NCA/NMC packs prefer lower daily charge limits to slow both modes
- LFP chemistry tolerates frequent full charges and resists cycle aging better
- Real-world data shows roughly 1–2% annual capacity loss across most Tesla models
Which matters more depends on you Low-mileage owners parked in hot driveways? Calendar aging dominates. High-mileage daily drivers? Cycle aging takes the lead.
Why Tesla Recommends Against Routine 100% Charging
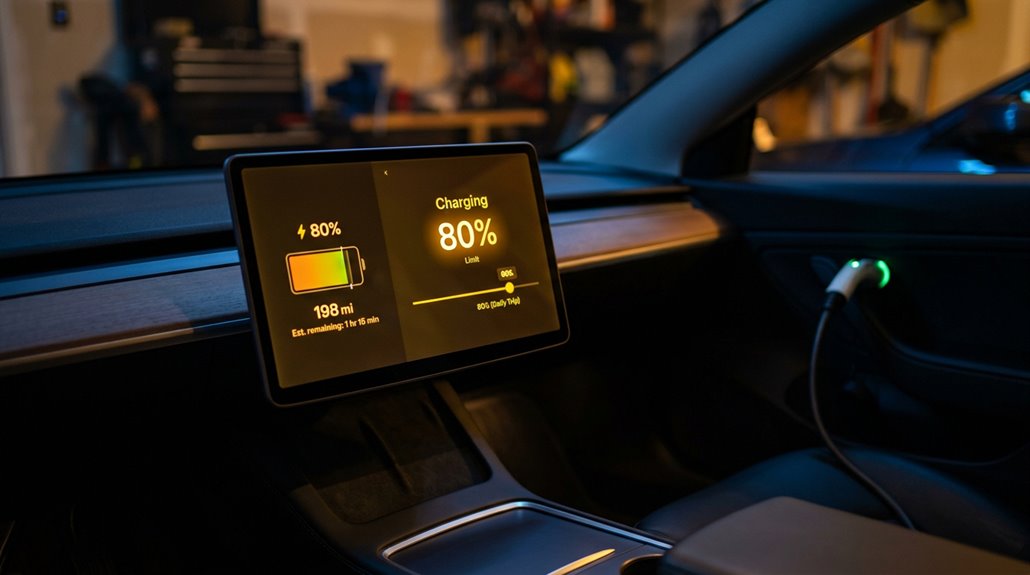
Charging your Tesla to 100% every night feels like the responsible thing to do—maximizing range, staying prepared—but the chemistry inside your battery pack tells a different story. High state-of-charge storage creates sustained voltage stress on individual cells, accelerating long-term capacity loss. Charge timing matters too—finishing a full charge hours before you leave compounds the damage.
| Scenario | Battery Stress Level | Recommendation |
|---|---|---|
| Daily 100% charging | High | Avoid routinely |
| Daily 80–90% charging | Low | Preferred default |
| 100% before road trip | Moderate | Acceptable occasionally |
| 100% left overnight | Very High | Strongly discouraged |
Tesla defaults most models to 90% for exactly this reason—convenience without unnecessary wear. Save full charges for when your route genuinely demands them.
How Tesla’s Battery Management System Protects Cell Longevity
While your Tesla’s charge limit setting does a lot of heavy lifting, the real guardian of long-term battery health is the Battery Management System (BMS)—a sophisticated control layer that monitors, regulates, and protects every cell in the pack simultaneously.
The real guardian of long-term battery health isn’t your charge limit—it’s the BMS working silently behind every cell.
The BMS handles more than simple oversight. It actively manages:
- Cell balancing — keeping cell-to-cell voltage differences within ~10 mV
- Capacity mapping — sampling behavior across charge states to polish range accuracy
- State-of-health tracking — identifying degradation trends before performance suffers
- Deep discharge prevention — protecting cells from damaging low-voltage exposure
- Thermal regulation — maintaining pack temperatures within roughly 3°C accuracy
Together, these functions extend usable battery life across a realistic 10–15 year service window—quietly doing the work you’ll never see but absolutely benefit from.
How Tesla’s Thermal System Manages Heat During Supercharging
Supercharging pushes serious current through your battery pack—and serious current means serious heat.
Tesla’s unified thermal system handles this through active thermal routing, directing coolant through a dedicated coolant chiller where refrigerant strips heat away from the loop more efficiently than airflow alone.
Battery heat loads can exceed 12 kW during rapid charging—roughly equivalent to running six space heaters simultaneously inside your pack.
The heat pump operates bidirectionally, cooling isolated coolant circuits during charging rather than simply warming your cabin in winter.
You’ll occasionally notice condensation management producing visible vapor near the vehicle’s front in cool, humid conditions—that’s the chiller working, not something broken.
Cooling intensity scales responsively as pack temperature climbs, with compressors, fans, and valve configurations adjusting automatically to sustain peak charge rates.
How Cold and Hot Weather Reduce Supercharging Speed
Temperature is the single biggest variable that determines whether your Supercharging session runs at peak power or crawls through the first half of your stop. Cold raises internal resistance; heat triggers protection limits. Both shrink your effective charging window.
Temperature dictates everything — cold builds resistance, heat triggers limits, and both silently steal your charging window.
- Below 50°F / 10°C: charge acceptance drops noticeably, and regenerative limitations appear simultaneously
- Below freezing: battery preconditioning can cut a 10–20 minute penalty down to 0–10 minutes
- Short cold drives: insufficient warm-up leaves you cold-soaked at the stall
- Above 113°F / 45°C: thermal management pulls power earlier than normal
- Hot plus high SOC: taper begins aggressively, making 55–65% a smarter departure target
Weather reshapes your entire charging curve, not just the peak number.
Why Real-World Supercharger Speeds Fall Short of Advertised Peak kW
When Tesla advertises “up to 250 kW” on a V3 Supercharger, that number is technically accurate — for about as long as it takes you to read this sentence. Peak myths persist because that headline figure describes a momentary ceiling, not a sustained rate.
Real-world testing shows a Model 3 hitting 201 kW briefly, then dropping to 198 kW within two minutes. A Model Y Performance can touch 230–245 kW near 10% state of charge — then thermal throttling kicks in, and the curve falls steadily.
Common Supercharger Session Errors and How to Fix Them
Even the most reliable technology fails sometimes, and a Supercharger session that refuses to start — or cuts out mid-charge — ranks among the more frustrating Tesla ownership experiences.
Most failures trace back to five culprits:
- Charge limit already reached — Tesla defaults to 80%, so the session won’t start if you’re already there
- Billing troubleshooting — expired cards or unverified accounts silently block authorization
- Connector maintenance neglect — debris in the charge port or on the plug breaks electrical contact
- Wrong stall number selected in the app versus the physical post
- Paired cabinet faults — stalls 1A and 1B share power hardware, so both fail together
Start by trying a different stall.
Then soft-reset the vehicle using both scroll buttons.
Most sessions recover within minutes.
How to Find and Filter Supercharger Locations Near You
Knowing how to fix a failed session only helps if you’re actually at a working station — which means finding the right one before you leave.
Your Tesla’s built-in route guidance displays nearest superchargers as lightning-bolt icons directly on the map, and trip planning accounts for elevation, traffic, and temperature automatically. The Tesla app mirrors this functionality remotely, showing available stalls before you’ve left your driveway. Tesla’s website adds custom filters to toggle between Superchargers, Destination Charging, and service centers by region. Individual location pages list stall count, maximum kilowatts, access hours, and pricing tiers for Tesla versus non-Tesla drivers.
Third-party tools like supercharge.info and PlugShare supplement this with community reviews and structured site data — useful when official sources lag behind real conditions.
Tesla’s Bidirectional Charging: What V2H and V2G Mean for Owners
Two distinct modes define this technology:
- V2H (Vehicle-to-Home): your battery powers home backup circuits during outages or peak-rate periods
- V2G (Vehicle-to-Grid): your battery exports stored energy into the utility network, supporting grid services during demand spikes
- Cybertruck currently leads Tesla’s bidirectional lineup in public discussions
- Hardware requirements include a bidirectional charger, CT meter, and energy management equipment
- Practical benefits range from cutting time-of-use electricity costs to joining virtual power plant programs
Neither capability works universally across Tesla models yet — compatibility determines everything before you assume your car doubles as a power station.